
After discussing the importance of different types of Data Analytics, let’s explore the step-by-step process that enables analysts to transform raw data into actionable insights.
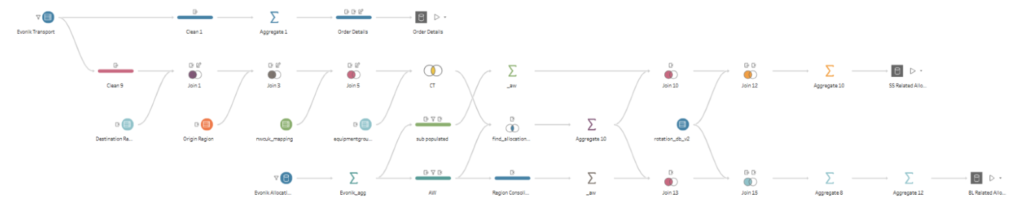
1. Data Cleaning and Preparation
Supply chain data comes in various formats, often with different references for the same booking (e.g., Freight Forwarder Reference, Customer Reference, Carrier Reference). Additionally, different customers use unique terminologies for identical processes. To standardize and interpret this data, Logward develops custom scripts that transform raw data into a unified format.
2. KPI Computation (Measures and Calculations)
While each customer has unique needs, the logistics industry follows certain standard methodologies. By combining industry standards with customer-specific insights, Logward’s Customer Success team collaborates with Analysts to develop relevant KPIs.
For example, a six-hour shipment delay may be critical for perishable goods but insignificant for construction materials. Custom KPIs help businesses evaluate performance based on their operational requirements.
3. Combining Insights with the Use of Categorical Fields
To extract deeper insights, measures (e.g., cost, volume etc) are analyzed in relation to categorical fields.
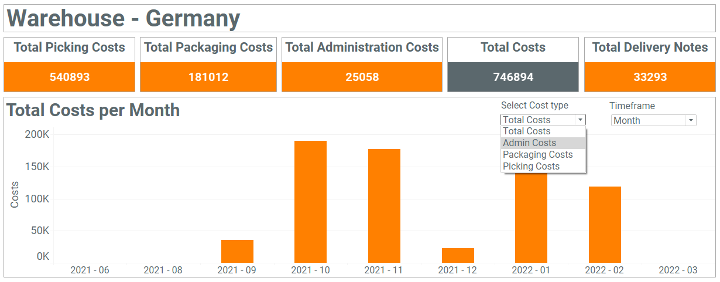
Example: In warehouse management, costs can be broken down into categories such as administration, picking, packaging, and transport. Analyzing cost breakdowns by category helps businesses optimize operations and budget allocations.
4. Finding suitable Visualizations
Sticking to the example of costs, and assuming that Logward is helping customers track their warehouse costs over the period of the last year, and that there are various cost categories involved in managing a warehouse, is it fair to show a simple pie chart with a percentage share break-up of all costs for the last year? It is, for instance, more interesting to see how transport costs have evolved over the years, but how do we get that from a pie chart?
Assuming it is possible to provide a trend of each of the cost categories over the last year, there can be different trend lines for each category on a single graph. This can be confusing – twelve months’ worth of data shown with a different coloured curved line for each category in one visualization.
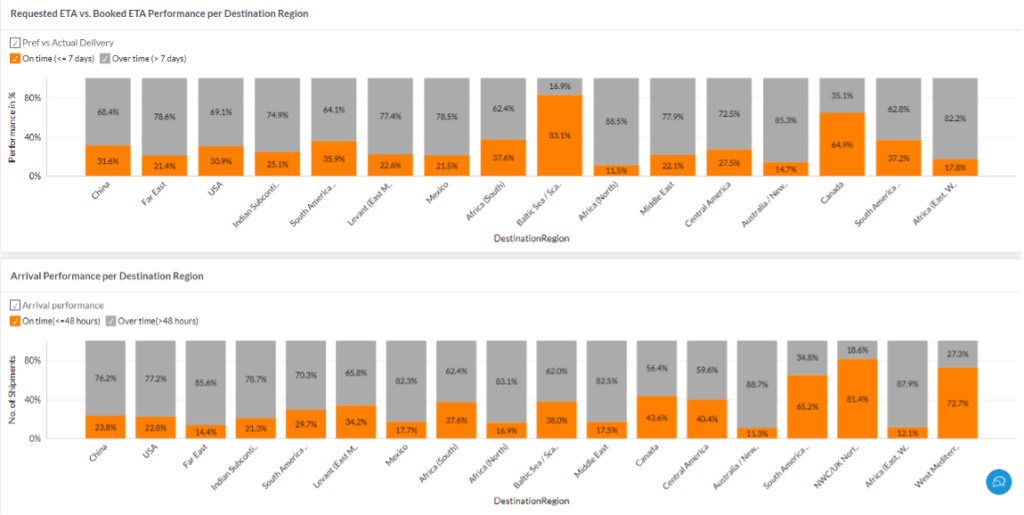
Here lies the challenge of figuring out and choosing suitable visualizations that aid the KPI as well. In the given example a pie chart is not the best solution, but it certainly is for looking at measures such as distribution of On-Time Shipments vs. Delayed Shipments at the POD.
Here are some options:

Storytelling
All efforts culminate into helping Logward analysts produce dashboards and reports that not only provide a picture of what has happened but also what is potentially about to happen. This coupled with prior awareness of the sequence of events scheduled as per customers’ operational processes, helps prepare reports that are telling a story rather than being just a dump of statistics and random numbers. This storytelling has an impact because customers’ data when shared via dashboards is easier to grasp. The strength of storytelling through dashboards lies in making information easier to grasp and, in this way, improving decision-making.
Click here to explore Logward’s Transport Order Journey dashboard.
Conclusion
Large volumes of data hold no value unless they are cleaned, combined, and transformed into actionable insights. In logistics, domain expertise must be incorporated at every step to ensure the most relevant and impactful outcomes.
By leveraging Data Analytics, Logward empowers businesses to navigate the complexities of supply chain management with greater efficiency and foresight.
Meet No-Code Supply Chain Execution:
Customize Locally, Govern Globally, Deliver Fast
If you have any questions or just want to say hi, feel free to reach out to us here.